
Document Type : Research Paper
1. Introduction
Surface tension is a characteristic property of fluids as scientific and technological researches on many areas need data on surface tension of the materials, such as chemical engineering, materials engineering, oil recovery, environmental protection, etc [1,2]. The surface tension of pure liquids and of liquid mixtures is often required in calculations such as those involving flow through porous media or boiling heat transfer.
In addition to experimental measurements, numerous theoretical researches have been carried out on the surface tension modeling [3-5]. Some of the presented models have a very strong theoretical basis such as those that are based on statistical mechanical theories of liquids and density functional theory [2,6]. Also corresponding state principles have been employed to predict the surface tension of pure materials [7-10]. The experimental data of surface tension for non-polar liquids have been correlated by utilizing the Riedel parameter at the critical point [7]. The critical temperature, pressure and acentric factor have been used as correlation parameters for determining the surface tension [9].
Two-reference corresponding states methods were initially proposed by Rice and Teja [11] in which critical temperature and volume were used to obtain a correlation. Later, Zuo and Stenby employed the same method for calculating surface tensions where critical pressure and temperature were considered as correlation parameters [12]. These equations have not presented satisfactory results for chemical compounds with strong hydrogen-bonding forces. To overcome these hurdles, Sastri and Rao introduced a correlation based on critical pressure and temperature, normal boiling point temperature, reduced temperature and reduced boiling temperature [13]. Although these equations are usually much simpler, their dependency on experimental data for each component limits their application to the cases for which some experimental data exist. These methods usually fail to give accurate predictions for other situations. The surface tension of a liquid mixture is not a simple function of the surface tensions of the pure components. In general, there are several approaches for estimating the surface tension of mixtures (i) based on empirical or semiempirical relations suggested first for pure fluids and (ii) based on statistical mechanical grounds. It is impractical to measure the surface tension for all liquids and liquid mixtures of interest and a method for the prediction of surface tension is therefore of practical importance [11,14,15].
Because of nonlinear nature of surface tension, artificial neural network method may be considered as an alternative tool for the prediction of surface tension. Gharagheizi, et al. applied an artificial neural network-group contribution method to predict the surface tension of pure chemical compounds [16]. Kumar, et al. effectively used parachor, density and refractive indices as input parameters required in the neural network for the prediction of surface tension of various polar and non-polar compounds [17]. Strechan, et al. used artificial neural network for correlations of the surface tension of molecular liquids [10]. Furthermore, artificial neural network has been applied for surface tension prediction of pure liquid metals [18]. To the authors' best knowledge, there has been no study on the application of artificial neural network for the surface tension prediction of hydrocarbon mixtures.
In this study, a feed-forward artificial neural network with Levenberg–Marquardt training algorithm was applied in order to investigate its capability in prediction of the surface tension of 20 hydrocarbon mixtures. The proposed ANN model results were compared with four well-known classical models.
2. Research Method
2.1. Classical models
Numbers of correlations based on the law of corresponding states have been developed for the prediction of surface tension (σ) which relate surface tension to the absolute temperature (T). Brock and Bird [7] proposed Eq. 1 for non-polar liquids.
| |
(1) |
where σ is the surface tension (dyn/cm) and is the Riedel parameter [19] at the critical point and is defined through Eq. 2.
 |
(2) |
where T is the absolute temperature (K), P is pressure (bar) and subscripts c, r and b denote the critical, reduced and boiling values respectively.
Pitzer [20] presented a corresponding state relation for surface tension in terms of critical pressure (Pc), critical temperature (Tc) and acentric factor (ω) as shown in Eq. 3.
| |
(3) |
Zuo and Stenby [12] used a two-reference fluid corresponding state to estimate the surface tensions as was shown in Eq. 4.
 |
(4) |
In this method, the surface tension for the fluid of interest is related to the surface tension of two reference fluids, methane (1) and n-Octane (2) by Eq. 5.
| |
(5) |
where the surface tension of methane is calculated by Eq. 6.
| |
(6) |
and the surface tension of n-octane is calculated by Eq. 7.
| |
(7) |
Even though the three above-mentioned corresponding-states methods are satisfactory for the non-polar liquids, they are not suitable for compounds that exhibit strong hydrogen-bonding (e.g. alcohols, acids). To deal with these types of compounds, Sastri and Rao [13] modified the equations as presented in Eq. 8.
 |
(8) |
where the values for the constants are presented in Table 1.
|
Table 1. Values for the constants of Eq. 8. |
|||||
|
|
K |
X |
Y |
Z |
m |
|
Alcohols |
2.28 |
0.25 |
0.175 |
0 |
0.8 |
|
Acids |
0.125 |
0.50 |
-1.5 |
1.85 |
1.22 |
|
All others |
0.158 |
0.50 |
-1.5 |
1.85 |
1.22 |
2.2. Artificial neural network (ANN)
Neural networks are composed of simple elements operating in parallel. These elements are inspired by biological nervous systems. As in nature, the network function is determined largely by the connections between elements. One can train a neural network to perform a particular function by adjusting the values of the connections (weights) between elements. Commonly, neural networks are adjusted or trained, so that a particular input leads to a specific target output.
In an ANN, a neuron sums the weighted inputs from several connections and then outputs of neurons are produced by applying transfer function to the sum. There are many transfer functions but the most common one is sigmoid which is used in this study as presented in Eq. 9.
| |
(9) |
where is the sum of weighted inputs to each neuron and is the output of each neuron which is calculated through Eq. 10.
| |
(10) |
where denotes connection between node j of interlayer l to node i of interlayer l-1, bj is a bias term and n is the number of neuron in each layer. In any interlayer l and neuron j input values integrate and generate.
In order to minimize the difference between experimental data and the data calculated by neural network, the afore-mentioned process repeats for the total number of training data. After training, validation of neural network can be done by testing the data.
Numerous types of the artificial neural networks exist such as multi-layer perceptron (MLP), radial basis function (RBF) networks and recurrent neural networks (RNN) where the former was used in this study. Multi-layer perceptron networks are one of the most popular and successful neural network architectures which are suited to a wide variety of applications such as the prediction and process modeling [21-23].
2.3. Preparation of dataset
578 datasets for surface tension of 20 hydrocarbon mixtures at different temperature and composition were collected [24] in addition to the critical temperature, critical pressure, critical volume, acentric factor, normal boiling point, molecular weight and ideal liquid density for pure components which were considered as the input for the ANN. Table 2 shows the list of hydrocarbon mixtures, the number of data point for each mixture and the temperature range. Furthermore, Table 3 shows the values of the physical properties of pure hydrocarbons. In this study, the data sets were divided into three parts: training subset (60% of all data), validation subset (10% of all data) and testing subset (30% of all data). To avoid larger number from overriding smaller number, all data is normalized between [0.1-0.9] using Eq. 11.
 |
(11) |
|
Table 2. The list of experimental data used in this study [24]. |
||
|
Mixtures |
Number of data point |
Temperature (K) |
|
Tetrachloromethane - Iodomethane |
47 |
288-308 |
|
Tetrachloromethane - Nitromethane |
33 |
303-317 |
|
Tetrachloromethane - Methanol |
12 |
308 |
|
Tetrachloromethane - Acetonitrile |
44 |
298-317 |
|
Tetrachloromethane - Iodo-ethane |
33 |
298-322 |
|
Tetrachloromethane - Nitroethane |
33 |
303-317 |
|
Tetrachloromethane - Ethanol |
18 |
293-345 |
|
Tetrachloromethane - Dimethylsulfoxide |
24 |
303-322 |
|
Formic acid - Acetic acid |
34 |
287-349 |
|
Formic acid - Pyridine |
27 |
287-298 |
|
Formic acid - 2-methyl-aniline |
8 |
298 |
|
Iodomethane - Acetic acid |
33 |
293-313 |
|
Nitromethane - Acetic acid |
11 |
293 |
|
Nitromethane - Benzene |
26 |
293-303 |
|
Nitromethane - Cyclohexane |
6 |
293 |
|
Methane - Propane |
46 |
258-338 |
|
Methanol - Acetic acid |
11 |
308 |
|
Methanol - Ethanol |
50 |
293-333 |
|
Methanol - Dimethylsulfoxide |
55 |
293-323 |
|
Methanol - Benzene |
27 |
273-303 |
|
Table 3. Physical properties of pure hydrocarbons used in this study. |
|||||||
|
Hydrocarbons |
Critical Temperature (˚C) |
Critical pressure (bar) |
Critical volume (m3/kgmol) |
Acentric Factor |
Normal boiling point (˚C) |
Molecular weight |
Ideal liquid density (kg/m3) |
|
Tetrachloromethane |
283.3 |
45.6 |
0.2759 |
0.193 |
76.75 |
153.8 |
1601 |
|
Nitromethane |
313.9 |
63.1 |
0.1732 |
0.31 |
101.1 |
61.04 |
1138 |
|
Methanol |
239.4 |
73.76 |
0.1270 |
0.557 |
64.65 |
32.04 |
795.7 |
|
Acetonitrile |
272.4 |
48.2 |
0.1729 |
0.327 |
81.65 |
41.05 |
782 |
|
Iodo-ethane |
278.9 |
47 |
0.2705 |
0.1563 |
72.45 |
156 |
1961 |
|
Nitroethane |
321.8 |
51.16 |
0.2295 |
0.3684 |
114.8 |
75.07 |
1052 |
|
Ethanol |
240.8 |
61.47 |
0.1671 |
0.6444 |
78.25 |
46.07 |
796 |
|
Dimethylsulfoxide |
455.9 |
56.5 |
0.227 |
0.2806 |
189.0 |
78.14 |
1105 |
|
Formic acid |
296.9 |
55 |
0.112 |
0.3525 |
100.6 |
46.03 |
1225 |
|
Pyridine |
346.9 |
56.2 |
0.254 |
0.243 |
115.2 |
79.10 |
988.8 |
|
2- methyl-aniline |
420.9 |
37.5 |
0.35 |
0.438 |
200.4 |
107.2 |
1002 |
|
Iodomethane |
251.9 |
65.9 |
0.1842 |
0.1446 |
42.55 |
141.9 |
2293 |
|
Acetic acid |
319.6 |
57.7 |
0.1710 |
0.447 |
118.0 |
60.05 |
1052 |
|
Benzene |
288.9 |
49.24 |
0.26 |
0.215 |
80.09 |
78.11 |
882.2 |
|
Cyclohexane |
280.1 |
40.53 |
0.308 |
0.2133 |
80.73 |
84.16 |
781.8 |
|
Methane |
-82.45 |
46.41 |
0.099 |
0.0115 |
-161.5 |
16.04 |
299.4 |
|
Propane |
96.75 |
42.57 |
0.2 |
0.1524 |
-42.1 |
44.10 |
506.7 |
2.4. ANN modeling
Programming, validation, training and testing of the ANN model were carried out by MATLAB 7.7.0. To determine the optimized values of weights and biases, the following steps were done:
3. Results and Analysis
Three layers feeding forward neural network were used for surface tension prediction of 20 hydrocarbon mixtures and all parameters of neural network were determined by trial and error procedure. According to the experimental data and for a fair comparison with the classical models, temperature (T), composition (x), critical temperature (Tc), critical pressure (Pc), critical volume (Vc), acentric factor (ω), normal boiling point (Tb), molecular weight (M) and ideal liquid density (ρ) of mixtures were used as inputs to our proposed neural network.
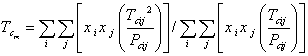
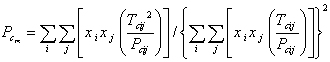
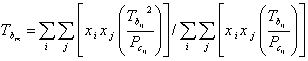
The physical properties of hydrocarbon mixture were related to the physical properties of pure components, using mixing rules as were shown in Eqs. 12-13 for mixture critical temperature (Tcm) and mixture critical pressure (Pcm) respectively.
 |
(12) |
 |
(13) |
where xi and xj are the composition of component i and j in the mixture. Binary critical temperature (Tcij) and binary critical pressure (Pcij) were obtained through Eqs. 14-15, respectively.
| |
(14) |
 |
(15) |
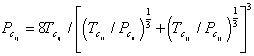
Furthermore, mixture normal boiling point (Tbm), mixture critical volume (Vcm), mixture acentric factor (), mixture molecular weight (Mm) and mixture ideal liquid density () were calculated using Eqs. 16-20, respectively.
 |
(16) |
| |
(17) |
| |
(18) |
| |
(19) |
| |
(20) |
where subscripts m and i denote the mixture and pure value of each physical property, respectively.
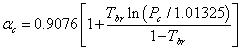
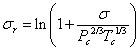
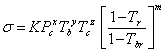
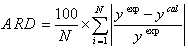
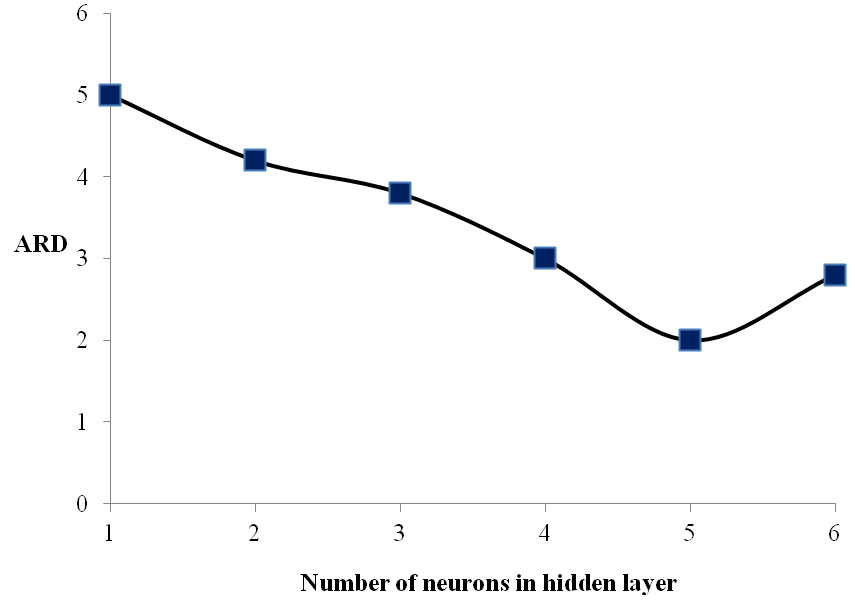
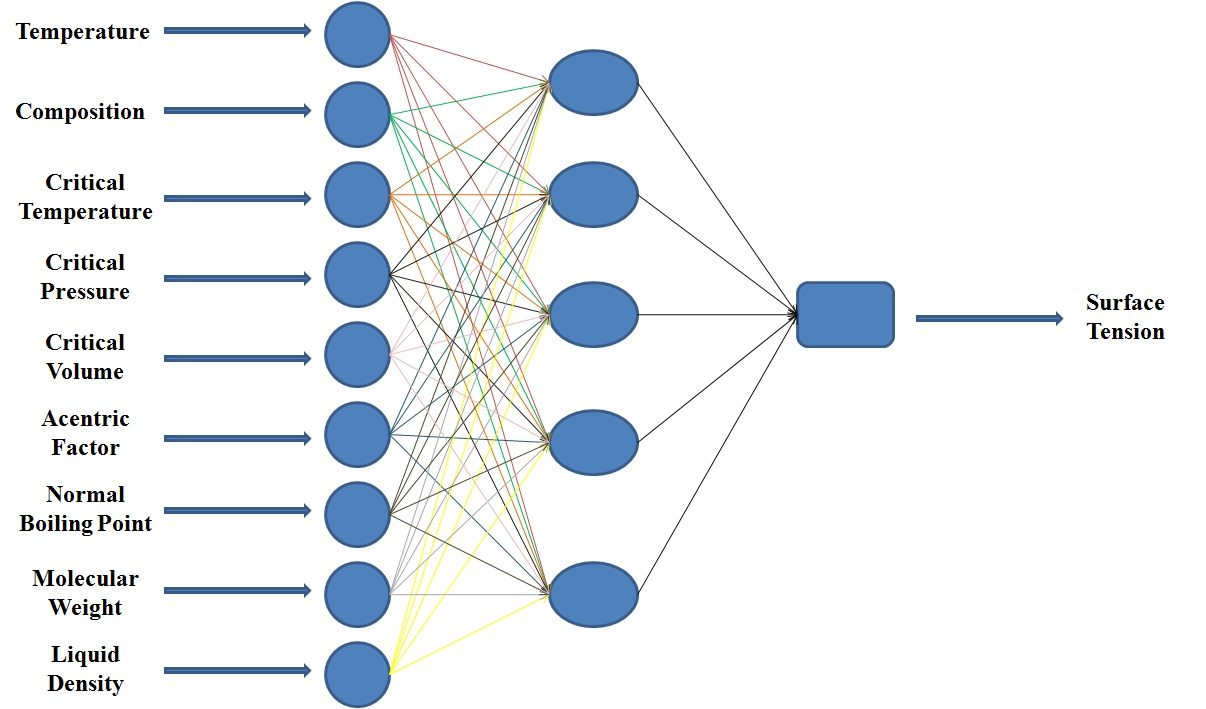
Sigmoid function was used as transfer function in hidden layers and purelin function was used as the transfer function of output layers. Also Levenberg-Marquardt back propagation learning algorithm was used for training. Usually one hidden layer is enough but the numbers of neurons in hidden layers need to be optimized for each problem. In order to optimize the number of neurons in hidden layers, average relative deviation (ARD), (calculated through Eq. 21) of testing data versus the neuron number in hidden layers is plotted, as was shown in Fig. 1. The Results showed that 9-5-1 is the best topology of the neural network (Fig. 2). The cross plot graph which shows the results of training and testing calculations are presented in Fig. 3.
 |
(21) |
 |
|
Figure 1. ARD of testing data versus neuron number in hidden layer. |
 |
|
Figure 2. Topology of the proposed neural network. |
 |
|
Figure 3. Cross plot graph of the results of training and testing calculations. |
Surface tension of each hydrocarbon mixtures was further calculated by four aforementioned classical models: Brock and Bird (Eq. 1), Pitzer (Eq. 3), Zuo-Stenby (Eq. 4) and Sastri-Rao (Eq. 8). The mixing rules used in these four models were the same as the mixing rules used in artificial neural network method.
The accuracy of artificial neural network and four well-known classical models were tabulated in Table 4. They indicate that ARD of artificial neural network is 3.72223% while the ARD of Brock and Bird, Pitzer, Zuo-Stenby and Sastri-Rao models are 28.56102, 25.23901, 25.49967 and 13.58419 respectively.
One of the best advantages of artificial neural network is low dependency of accuracy of this method to the type of compounds. Classical methods give quite accurate results for some compounds while their answers for some other compounds may be very inaccurate. To have a quantitative measure of this quality, standard deviation parameter was calculated for each method which is presented in Table 4. The standard deviation of ARD for Brock and Bird, Pitzer, Zuo-Stenby and Sastri-Rao models are 23.77569, 18.44848, 13.00388 and 9.63137 respectively while standard deviation of ARD for artificial neural network is 3.63001.
|
Table 4. Accuracy of artificial neural network and four well-known classical models. |
|||||
|
Compound |
Brock –Bird [7] |
Pitzer [20] |
Zuo –Stenby [12] |
Sastri –Rao [13] |
ANN |
|
Tetrachloromethane - iodomethane |
2.7273 |
2.0888 |
17.3285 |
3.538 |
2.1173 |
|
Tetrachloromethane - nitromethane |
10.1782 |
11.6841 |
19.9798 |
3.4726 |
2.356 |
|
Tetrachloromethane - methanol |
41.3494 |
50.4831 |
50.631 |
15.6244 |
2.387 |
|
Tetrachloromethane - acetonitrile |
1.8799 |
4.2103 |
16.5798 |
4.1368 |
9.9893 |
|
Tetrachloromethane - iodo-ethane |
13.3881 |
10.2459 |
13.0284 |
11.7174 |
1.9742 |
|
Tetrachloromethane - nitroethane |
7.4096 |
10.5393 |
13.6943 |
1.5743 |
1.3618 |
|
Tetrachloromethane - ethanol |
27.1397 |
34.5764 |
37.6013 |
7.6215 |
0.9921 |
|
Tetrachloromethane - dimethylsulfoxide |
13.8216 |
17.434 |
15.0959 |
8.1284 |
8.077 |
|
formic acid - acetic acid |
28.1053 |
30.3465 |
15.0238 |
12.9732 |
1.2466 |
|
formic acid - pyridine |
12.8345 |
11.2285 |
19.3833 |
22.2164 |
8.8339 |
|
formic acid - 2-methyl-aniline |
5.4993 |
3.8937 |
26.2993 |
16.7077 |
0.0213 |
|
Iodomethane - acetic acid |
33.716 |
36.5589 |
36.8824 |
15.3109 |
4.549 |
|
Nitromethane - acetic acid |
32.0827 |
34.4518 |
19.3669 |
9.3977 |
1.2423 |
|
Nitromethane - benzene |
92.2474 |
12.6289 |
10.7804 |
20.7877 |
7.4623 |
|
Nitromethane - cyclohexane |
6.1214 |
7.8804 |
6.8466 |
2.93 |
0.8193 |
|
Methane - propane |
37.3632 |
41.1241 |
25.4103 |
44.6959 |
2.4441 |
|
Methanol - acetic acid |
57.8839 |
65.3992 |
43.6485 |
19.1128 |
13.4216 |
|
Methanol - ethanol |
71.7885 |
25.3453 |
48.2051 |
21.9246 |
1.791 |
|
Methanol - dimethylsulfoxide |
47.1162 |
56.4907 |
33.2154 |
16.2331 |
1.6447 |
|
Methanol - benzene |
28.5681 |
40.259 |
40.9924 |
13.5803 |
1.7139 |
|
Average |
28.56102 |
25.23901 |
25.49967 |
13.58419 |
3.72223 |
|
Standard Deviation |
23.77569 |
18.44848 |
13.00388 |
9.63137 |
3.63001 |
4. Conclusion
In this study, artificial neural network was used to predict the surface tension of hydrocarbon mixtures. The accuracy of our proposed model was compared to four well-known empirical equations. It showed higher accuracy for the artificial neural network method. Also, results of standard deviation indicated that these empirical relations are so dependent on the type of compounds and some special parameters, while ANN is more independent. The optimized neural network parameters such as inputs and the number of neurons in hidden layers were presented for the calculation of surface tensions for the before mentioned compounds and can be used by other researchers in solving the problems which deal with the surface tension calculations.
